RiskRate Reporting
Important: These reporting features are only available for customers on the NAVEX One GRC Platform solution. Contact NAVEX Customer Support by submitting a request in the Community if you wish to inquire further on this for your organization.
To access Reporting:
-
Log into your NAVEX One GRC Platform solution, or into RiskRate.
-
If in the RiskRate application, click
 on the top of the screen and select Analytics & Benchmarking.
 -
Reporting Insights displays with RiskRate as a menu item. Click to open any of the available reports.
RiskRate Dashboards
RiskRate Reporting includes three (3) dashboards:
-
Third Parties – An overview of third party data
-
Reports and Interviews – An overview of report and interview data
-
Risk Codes – An overview of risk code data
Note: Permissions can be set up to where a user has access to one or more of the dashboards. You will see the dashboards to which you have been granted permission.
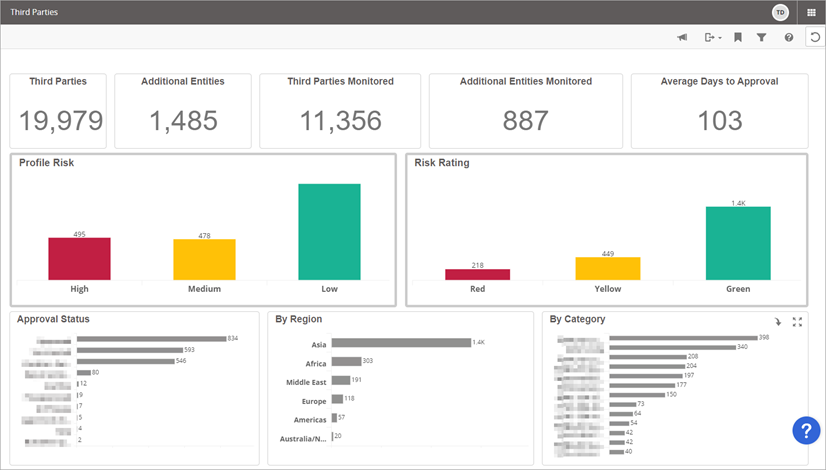
Third Parties
The Third Parties dashboard shows general information about third parties, such as the number of third parties, additional entities, third parties monitored, additional entities monitored, and average days to approval. Additionally, there are risk-related dashlets that show the breakdown of third parties based on profile risk score, as well as risk rating. Finally, there are dashlets that break down third parties by approval status, region, and category.
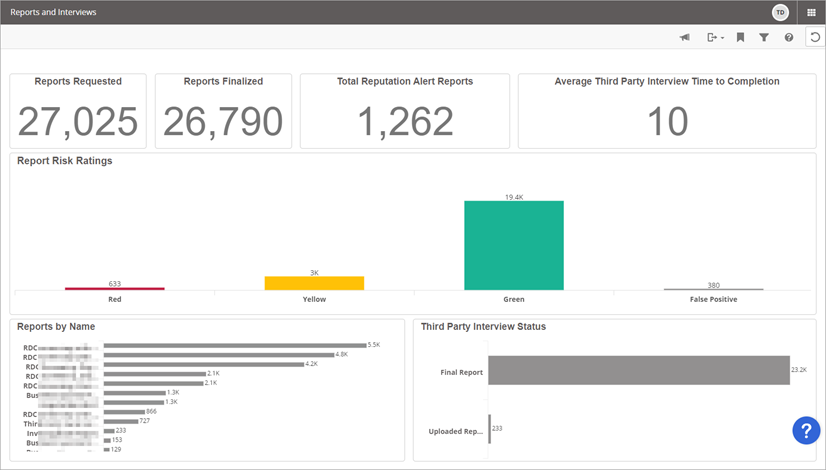
Reports and Interviews
The Reports and Interviews dashboard includes a count of reports requested, reports finalized, total reputation alert reports, and average third party interview time to completion (number of days). Additionally, there is a dashlet that breaks down third party reports by risk ratings. Finally, there are dashlets that show the number of reports by name and third party interviews based on status.
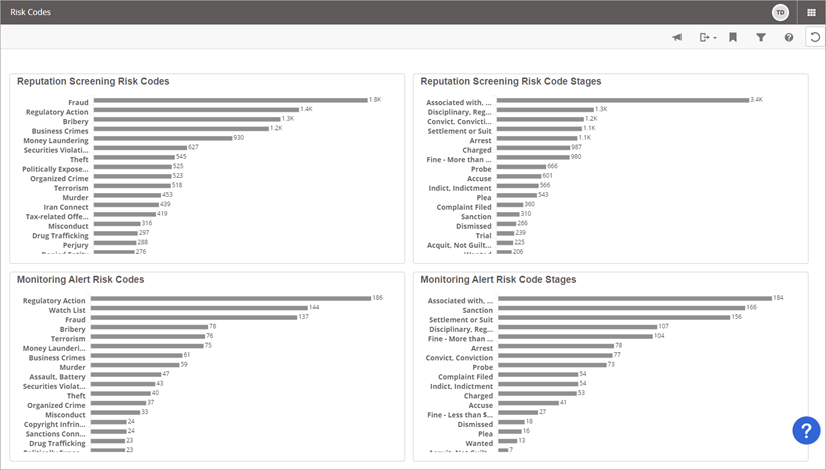
Risk Codes
The Risk Codes dashboard shows a breakdown of risk code count by both Reputation Screening and Monitoring Alert stages.
Dashboard Actions
Within each report dashboard, there are the following menu options:
-
Notifications* – Create scheduled email notifications to monitor dashboard updates
-
Export Dashboard* – Export dashboard to PDF and PowerPoint formats
-
Bookmarks* – Bookmark dashboards to retrieve later
-
Filters – Gain deeper insights into reports using filters
-
Reset – Reset report filters to go back to its original state
Note: For the actions with an asterisk (*), permissions can be set up to where a user has or is denied access. You will see the dashboards to which you have been granted permission.
Click the icon on the top left to perform the desired action.
Notifications
To create a scheduled email notification:
-
From the top right of the dashboard, click the Notification icon
 .
.A Notification Center appears for managing notifications.
-
Click the plus sign + located to the left of the Notification Center.
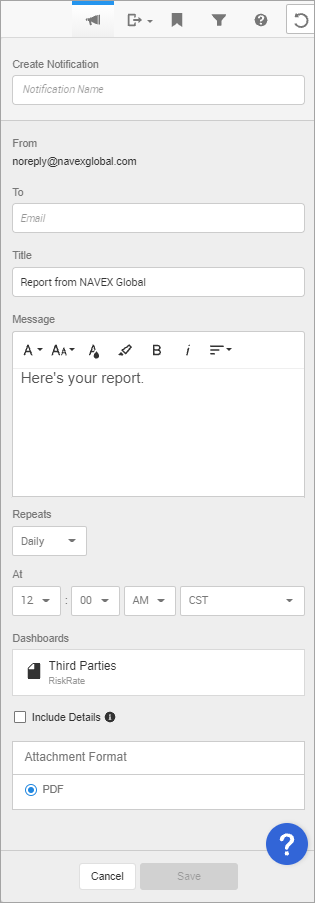
A Create Notification window displays.
-
Enter a Notification Name.
-
Type in the email address in the To box.
-
Optionally, update the Title (subject) of the email.
-
Optionally, update the email Message.
-
Select the notification frequency from the Repeats drop-down list (Daily, Weekly, Monthly).
-
Select the specific time criteria for the report using the At drop-down lists.
-
Select the Include Details check box to include additional information (Collection Name, Dashlet Name, Timestamp, and Filters applied to dashlet).
-
Click Save.
Once saved, the notification is available in the Notification Center. You can further edit it, run it immediately, delete it, etc.
Export
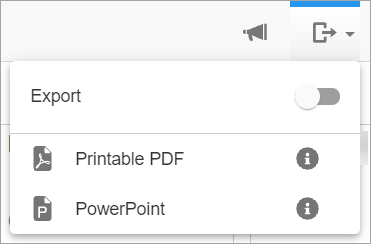
Click the Export icon ![]() to export to PDF or PowerPoint formats.
to export to PDF or PowerPoint formats.
Bookmarks
To add a bookmark for future retrievals:
-
From the top right, click the bookmark icon
 .
. -
Click + to add/create bookmark.
A text box displays below with a default name of Bookmark.
-
Enter a name for the bookmark.
-
Click the check mark to save.
Once created, you can click the bookmark to view the report dashboard. Additionally, there is an action icon (![]() ) to where you can Rename, Copy Bookmark URL, or Delete the bookmark.
) to where you can Rename, Copy Bookmark URL, or Delete the bookmark.
Filters
Each report dashboard will have their own unique list of available filters.
To add one or more filters:
-
Click the filter icon
 .
. -
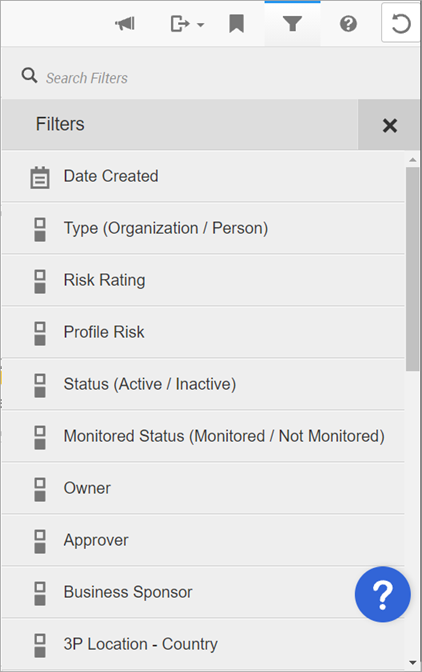
Click the desired filter from the list. (Below is a list of some of the filters for Third Parties.)
-
Enter the criteria for the specific filter.
-
Click Apply located at the bottom right.
The applied filter will display at the top of the dashboard. These can be removed individually by hovering over it and clicking the X.
-
Repeat steps 1-4 for each filter.
Reset
Click the reset icon ![]() to remove report filters and go back to the dashboard's original state.
to remove report filters and go back to the dashboard's original state.
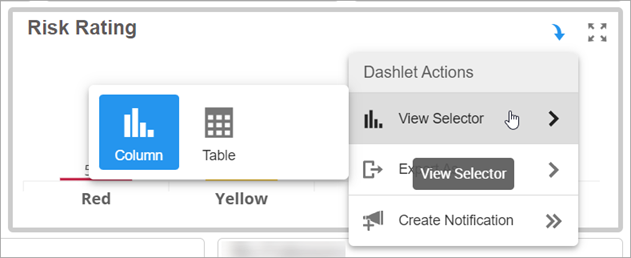
Dashlet Actions
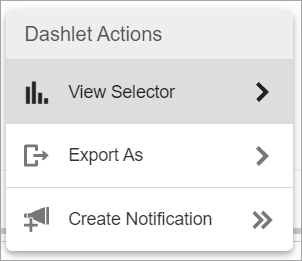
Within each dashboard, report actions are available for certain dashlets. Users can do the following:
-
Select between a table or column graph view
-
Export dashlets to PDF, Excel, and Email formats
-
Create notifications to receive updates for specific dashlets
-
Expand dashlets to be full screen
Hover over the dashlet, click![]() and then click the desired task.
and then click the desired task.
Select Between Table or Column View
The View Selector options allows you to switch between Column or Table view.
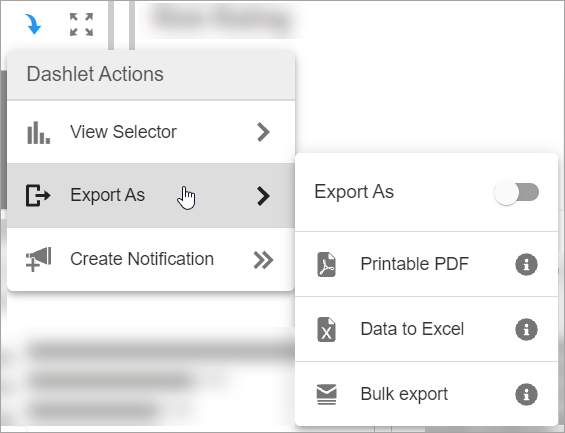
Export
The Export As option allows you to export dashlet data to PDF, Excel, or email (Bulk export).
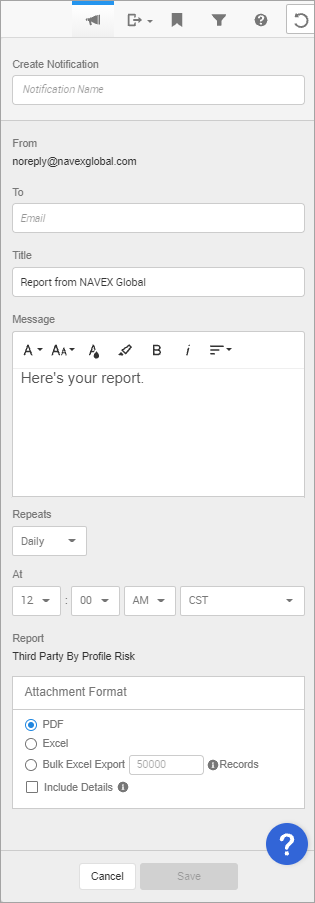
Create Notification
The Create Notification option allows you to create a scheduled notification email with the report dashlet data.
To create a notification:
-
From the dashlet, click
 and then Create Notification.
 A Create Notification window displays.
-
Enter a Notification Name.
-
Type in the email address in the To box.
-
Optionally, update the Title (subject) of the email.
-
Optionally, update the email Message.
-
Select the notification frequency from the Repeats drop-down list (Daily, Weekly, Monthly).
-
Select the specific time criteria for the report using the At drop-down lists.
-
Choose the Attachment Format (PDF, Excel, Bulk Excel Export), including the number of records if Bulk Excel Export is selected. Then, select the Include Details check box to include additional information (Collection Name, Dashlet Name, Timestamp, and Filters applied to dashlet).
-
Click Save.
Expand to Full Screen / Maximize
To get an expanded view of a particular dashlet, hover over it and click ![]() to maximize.
to maximize.
You will see the data displayed in full screen to better view and analyze the data.
Copyright © 2024 NAVEX Global, Inc. NAVEX Global® is a registered trademark/service mark of NAVEX Global, Inc. The NAVEX Global® logo is a trademark/service mark of NAVEX Global, Inc. Unauthorized use of NAVEX Global, Inc.’s trademarks/service marks is strictly prohibited without prior written permission from NAVEX Global, Inc.